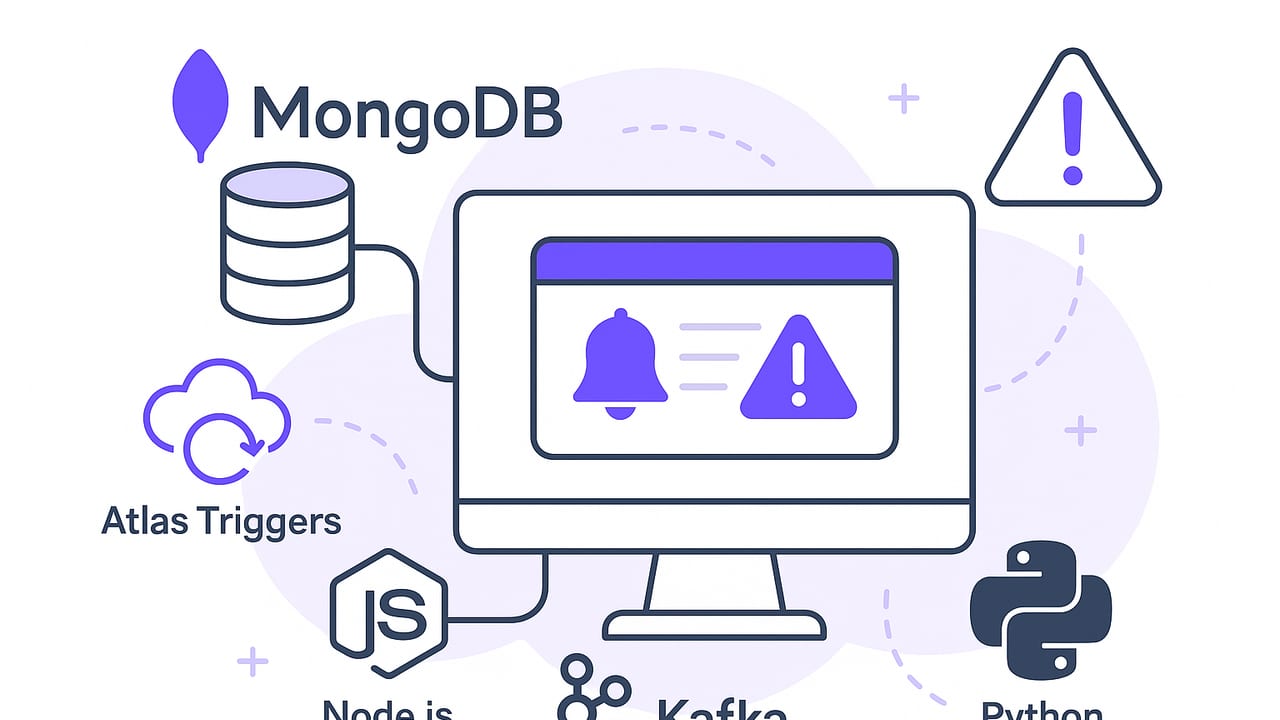
Operational teams, developers, and data analysts increasingly need near real time alerts for MongoDB to react to critical data changes: suspicious account activity, inventory depletion, SLA breaches, or failed transactions. Near real time typically means seconds or sub‑second latency from when a document changes to when an alert is delivered, with safeguards for reliability, scale, and security. This guide explains practical architectures, tools, and code examples to help you implement robust MongoDB change notifications that actually reach the right people at the right time.
What Counts as Near Real Time for MongoDB Alerts?
In practice, near real time balancing act involves:
- Latency: A few hundred milliseconds to a few seconds from write to alert delivery.
- Precision: Filtered to only relevant events (notifying on every update is noisy and expensive).
- Reliability: Survives restarts, network partitions, and schema changes.
- Security: Minimum privileges and encrypted connections; PII redaction when necessary.
MongoDB provides strong primitives to meet these goals, with different trade‑offs depending on your environment (Atlas vs self‑managed), scale, and alerting channels.
Core Options for Near Real‑Time Alerts
1) MongoDB Change Streams (Recommended)
Best for: Most production systems needing near real time alerts for MongoDB with fine‑grained filters.
Change Streams let you subscribe to insert, update, replace, delete, and DDL‑like events on a collection, database, or entire cluster. They require a replica set (Atlas clusters qualify). You can apply an aggregation pipeline to limit the changes and project only needed fields. Change Streams expose resume tokens so you can recover from interruptions without duplication.
- Pros: Low latency, server‑side filtering, resumability, minimal polling overhead.
- Cons: Requires replica set; handling shard topology changes adds complexity at very large scale.
2) MongoDB Atlas Triggers
Best for: Managed, serverless alerts without maintaining consumers.
Atlas Triggers (database triggers) run server‑side functions in response to changes. You write a simple function to call a webhook, send an email, or post to Slack when criteria are met. Maintenance is minimal and scaling is managed by Atlas.
- Pros: Zero infrastructure to operate; convenient UI; integrates tightly with Atlas.
- Cons: Limited to Atlas; advanced custom routing, complex batching, or cross‑system orchestration may still require external services.
3) Kafka Integration (MongoDB Kafka Connector or Debezium)
Best for: High‑scale, multi‑team streaming architectures.
Publish MongoDB changes to Kafka and let downstream consumers handle alert logic. You can use the MongoDB Kafka Connector or Debezium’s MongoDB connector to capture changes and route them into topics. Consumers implement filters, thresholds, and notification delivery.
- Pros: Decoupling, replay capability, multiple consumers, enterprise‑grade observability.
- Cons: Higher operational overhead and cost; eventual complexity in schema evolution and consumer management.
4) Oplog Tailing (Legacy)
Best for: Niche cases on self‑managed replica sets where Change Streams can’t be used (rare today).
Tailing the local.oplog.rs offers low‑level access to replication events. It’s powerful but easy to get wrong. Most teams should prefer Change Streams, which wrap oplog tailing with a supported API.
- Pros: Fine control, works on older versions.
- Cons: Complex, brittle, and not recommended if Change Streams are available.
5) Scheduled Polling (Fallback)
Best for: Simple systems or when real‑time primitives are unavailable.
Polling adds load, can miss transient states, and usually results in higher latency. If you must poll, index aggressively, limit result sets, and store checkpoints to avoid duplicates.
Designing the Right Alert Flow
To translate change events into actionable alerts, consider:
- Filtering: Use Change Streams’ match stage to narrow events (e.g., only
insertin a specific collection, or updates wherestatusbecomes"failed"). - Thresholds and aggregation: Don’t alert on every change. Aggregate counts over windows (e.g., 5 failures in 1 minute).
- Routing: Engineer on‑call vs business users need different channels: push notifications, email, SMS, Slack, or webhooks.
- Deduplication: Use resume tokens, event IDs, or idempotent delivery with a persistent outbox.
- Rate limits and batching: Prevent alert storms via per‑rule rate limits, jitter, and grouping similar alerts.
Code Example: Node.js Change Stream Filter
The following sample listens for order status changes to "failed" and posts a webhook. It demonstrates low‑latency near real time alerts for MongoDB with server‑side filtering.
const { MongoClient } = require("mongodb");
const fetch = require("node-fetch");

(async () => {
  const uri = process.env.MONGODB_URI; // e.g. mongodb+srv://...
  const client = new MongoClient(uri, { appName: "alerts-service" });

  try {
    await client.connect();
    const db = client.db("shop");
    const coll = db.collection("orders");

    const pipeline = [
      { $match: {
          operationType: { $in: ["insert", "update", "replace"] },
          "fullDocument.status": "failed"
      } },
      { $project: {
          fullDocument: 1,
          updateDescription: 1,
          operationType: 1,
          clusterTime: 1
      } }
    ];

    const changeStream = coll.watch(pipeline, { fullDocument: "updateLookup" });

    changeStream.on("change", async (change) => {
      try {
        const payload = {
          orderId: change.fullDocument._id,
          status: change.fullDocument.status,
          amount: change.fullDocument.amount,
          at: change.clusterTime,
          type: change.operationType
        };
        await fetch(process.env.WEBHOOK_URL, {
          method: "POST",
          headers: { "Content-Type": "application/json" },
          body: JSON.stringify(payload)
        });
      } catch (err) {
        // log and persist for retry
        console.error("delivery error", err);
      }
    });

    changeStream.on("error", (err) => {
      console.error("stream error", err);
      // Persist resumeToken and restart the stream
    });
  } catch (e) {
    console.error(e);
  }
})();
Notes:
- fullDocument:
updateLookupfetches the updated document for update events. - Resume tokens: Persist
change._idto resume after downtime. - Security: Use a read‑only role scoped to the database/collection you watch.
Code Example: Python Aggregation Window
For bursty data, count failures in rolling windows and alert when they cross a threshold. Below is a simplified Python example using pymongo with a small in‑memory window; production systems should use Redis or Kafka Streams for durability.
from pymongo import MongoClient
from collections import deque
from datetime import datetime, timedelta
import os, requests

client = MongoClient(os.environ["MONGODB_URI"])
coll = client.shop.orders

pipeline = [
  { "$match": {
      "operationType": { "$in": ["insert", "update", "replace"] },
      "fullDocument.status": "failed"
  }},
  { "$project": {"fullDocument": 1, "clusterTime": 1} }
]

window = deque()  # stores timestamps
ALERT_THRESHOLD = 5
WINDOW_SECONDS = 60

with coll.watch(pipeline, full_document='updateLookup') as stream:
    for change in stream:
        now = datetime.utcnow()
        window.append(now)
        # drop old events
        cutoff = now - timedelta(seconds=WINDOW_SECONDS)
        while window and window[0] < cutoff:
            window.popleft()
        if len(window) >= ALERT_THRESHOLD:
            try:
                requests.post(os.environ["WEBHOOK_URL"], json={
                    "type": "orders_failed_spike",
                    "count": len(window),
                    "windowSeconds": WINDOW_SECONDS
                })
                window.clear()  # reset after alert
            except Exception as e:
                print("Alert delivery failed", e)
Filtering Smartly with Change Stream Pipelines
Use aggregation stages to cut noise and cost:
[
  { $match: {
      operationType: { $in: ["insert", "update"] },
      "ns.db": "shop",
      "ns.coll": "orders",
      $or: [
        { "fullDocument.amount": { $gt: 1000 } },
        { "updateDescription.updatedFields.status": "chargeback" }
      ]
  }},
  { $project: {
      orderId: "$fullDocument._id",
      amount: "$fullDocument.amount",
      status: "$fullDocument.status",
      at: "$clusterTime"
  }}
]
This pattern focuses alerts on high‑value orders and chargebacks, reducing alert fatigue.
Security and Compliance
- Least privilege: Create a role limited to the database/collection and needed actions like
findandchangeStream. - Encrypt everywhere: Use TLS for MongoDB connections and HTTPS for webhooks. Consider client‑side field level encryption for sensitive fields.
- PII minimization: Project only non‑sensitive fields; hash or tokenize identifiers before sending to alert channels.
- Secrets management: Store credentials in a vault or managed secret store; rotate regularly.
Tip: Treat your alert pipeline as a production system. Apply the same SLOs, runbooks, and on‑call readiness as your core services.
Delivery Channels and Reliability
- Email: Good for business stakeholders; batch to reduce noise.
- Push/SMS: Reserve for critical, high‑urgency events; enforce per‑user rate limits.
- ChatOps (Slack/Teams): Great for shared awareness and quick triage. Use threads to avoid spam.
- Webhooks: Flexible integration point to internal incident tooling.
For high reliability, implement:
- Outbox pattern: Persist alert intents before delivery; retry with exponential backoff.
- Idempotency keys: Prevent duplicate notifications on reconnect.
- Dead‑letter queue: Track permanently failed deliveries for manual review.
Approach Comparison
| Approach | Latency | Ops Overhead | Scope | When to Choose |
|---|---|---|---|---|
| Change Streams | Low (ms–s) | Low–Medium | Atlas or self‑managed replica set | Default choice for most teams |
| Atlas Triggers | Low | Low | Atlas only | Serverless convenience, minimal code |
| Kafka Connector | Low | Medium–High | Enterprise streaming | Multi‑consumer, replay needs |
| Oplog Tailing | Low | High | Self‑managed only | Legacy/edge cases |
| Polling | Medium–High | Low | Anywhere | Fallback when others not possible |
Testing and Observability
- Synthetic events: Seed test documents that should trigger alerts; verify end‑to‑end delivery.
- Chaos and failover: Restart consumers, rotate primaries, and validate resume tokens work.
- Metrics: Track time‑to‑alert, failure and retry counts, rule‑level volume, suppression rate.
- Tracing: Add correlation IDs from DB change to alert delivery to pinpoint bottlenecks.
Common Pitfalls and How to Avoid Them
- Alert storms: Add per‑rule throttles and aggregate windows.
- Lost events on restart: Persist resume tokens and verify resumeAfter during deployments.
- Schema changes: Use defensive projections and feature flags for new fields.
- Sharded clusters: Watch at the cluster level if you need global coverage; validate behavior during chunk migrations.
- Oversharing data: Redact PII before it leaves your network.
Deployment Checklist
- Ensure cluster is a replica set; enable Change Streams.
- Create least‑privilege user with
changeStreamandfind. - Define rule filters and thresholds; document owners.
- Implement retries, idempotency, and dead‑letter queues.
- Instrument metrics and logs; set SLOs for time‑to‑alert.
- Run synthetic tests and disaster recovery drills.
Putting It All Together
Building near real time alerts for MongoDB is straightforward with Change Streams or Atlas Triggers, and scales cleanly with Kafka when multiple teams consume the same event streams. Start by scoping what truly merits an alert, write precise filters, and invest in reliability patterns like resume tokens, idempotent delivery, and backoff‑based retries. With the right mix of server‑side filtering, secure connections, and careful routing, you’ll turn raw data changes into timely, actionable signals without drowning your teams in noise.
If you prefer a lightweight, mobile‑first workflow for monitoring database queries and receiving notifications, an iOS app like Query Alert can help centralize your alert checks and delivery channels while keeping connections read‑only and encrypted.